
Ancestry populations · Hunter Gatherer and Neolithic Farmer
Ancestral South Indian
The deep indigenous ancestry of the Indian subcontinent, reconstructed from ancient and present-day genomes as the southern pole of South Asian variation. One of the 13 curated source populations in the Hunter Gatherer and Neolithic Farmer era of the Ancestrify qpAdm ancient-DNA analysis.
Who they were
- Period
- 10000 – 2000 BC
- Era in the analysis
- Hunter Gatherer and Neolithic Farmer
- Region
- Indian subcontinent
- Role in the model
- Source (left) population — a reference qpAdm tests against
Ancestral South Indian (ASI) is the name given to the deep indigenous ancestry of the subcontinent, first inferred from present-day genomes as one of two poles along which Indian populations vary (Reich et al. 2009; Moorjani et al. 2013). Ancient DNA has since given it a concrete shape: it is best modelled as a mixture of an Andaman-related hunter-gatherer lineage with an Iranian-related ancestry that was already present in South Asia before farming reached the Indus (Narasimhan et al. 2019). No unmixed ASI individual has been sequenced; the source is reconstructed as a pole of the cline rather than sampled directly.
ASI-related ancestry is highest today in southern and tribal populations of India and lowest in the north-west, tracking the historical gradient that runs against the Ancestral North Indian pole. Outside South Asia it is rare, appearing mainly where South Asian migration has carried it. In the model it is the most easterly and southerly of the deep sources and separates cleanly from the Iranian Neolithic farmer source, with which it shares only its Iranian-related component.
In Ancestrify's qpAdm service, Ancestral South Indian is a source in the "Hunter Gatherer and Neolithic Farmer" era. The report shows its weight with a standard error and a Z-score, so you can see not only how much of the model it carries but how confidently that share is separated from zero, and a model that cannot support it is rejected rather than published. For genomes with South Asian heritage it is the source that captures what neither the Iranian farmer nor the steppe source can, and its weight is usually the clearest signal in the era.
Y haplogroup H and mtDNA M lineages are characteristic of populations rich in this ancestry, with F and L1 also frequent. A haplogroup alone is never evidence of a share: uniparental lines and autosomal proportions are separate questions.
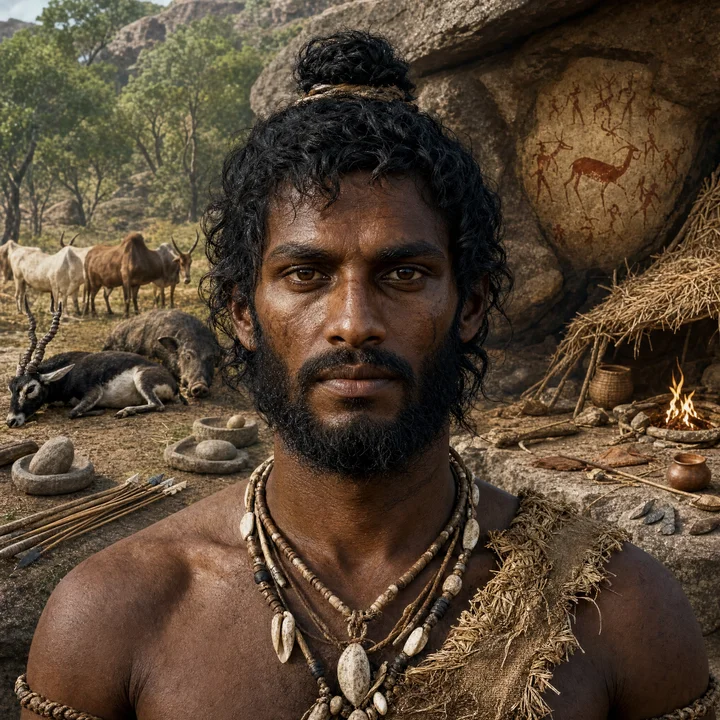
In your reportArtwork is an AI-generated artistic interpretation informed by the archaeological record — not documentary evidence.A reconstructed ancestral population inferred from genetic modeling as one of the two primary sources of South Asian ancestry, deeply divergent from both Ancestral North Indians (ANI) and East Asians. ASI-related ancestry is maximized in tribal Dravidian-speaking groups of southern India and emerged from a mixture of Iranian farmer-related ancestry and ancient local hunter-gatherer lineages. Following the decline of the Indus Valley Civilization (~1900 BCE), southeastern populations mixed with Iranian-related groups to form the ASI component observed in modern South Asians. Recent archaeogenomic studies have identified a related Proto-Dravidian ancestry in tribal groups like the Koraga, dating to approximately 4,400 years ago. The ASI component is central to understanding the deep population structure of the Indian subcontinent.
Where this population sits in the model
The Ancestrify qpAdm analysis models your genome once per era. The Hunter Gatherer and Neolithic Farmer era has 13 curated source populations, and Ancestral South Indian is one of them: every candidate model for that era is a combination of these sources, tested against a fixed set of outgroup populations, and only a model that passes the statistical fit check is published — with a p-value, and a standard error on every proportion.
A reference, not a verdict: every population on this page is a source the model tests your genome against — a well-sampled point in ancient genetic space that a mixture of ancestries can be expressed in terms of. A weight on it means your genome is well described as partly resembling those people; it is never a statement that they, specifically, were your ancestors, and a population that fits well is not the only one that could.
Read how the method works on the qpAdm analysis page, or the definitions in the glossary.
Model it yourself for free
The Ancestrify Lab runs in your browser, with no account. Paste a Global25 row into an admixture calculator that covers the Hunter Gatherer and Neolithic Farmer era, rank the closest ancient populations in the distance tool, or run f4, qpWave and qpAdm on the public panel in the AdmixTools 2 workbench. These are Global25 fits and exploratory statistics, not the formal qpAdm model of the paid analysis.
Questions
Who were the Ancestral South Indian (10000 – 2000 BC)?
Ancestral South Indian is one of the 13 curated source populations in the Hunter Gatherer and Neolithic Farmer era of the Ancestrify qpAdm analysis: a group of published ancient genomes from one archaeological context, pooled as a single reference the model can test your genome against.
Does Ancestral South Indian in my result mean they were my ancestors?
No. A source population is a reference the model tests against, never a statement about who your ancestors were. A coefficient on this source means the ancestry those burials represent helps explain your genome to within statistical noise — similar ancestry composition, not descent from those individuals. Ancestrify never claims a population is your ancestor.
What does a Ancestral South Indian percentage in a qpAdm model mean?
qpAdm estimates the mixture proportions that best explain your genome as a combination of the chosen sources, given a fixed set of outgroup (right) populations, and reports a p-value for whether the model is statistically acceptable together with a standard error for every proportion. The percentage is that estimated share, with its uncertainty published beside it.
How do I get a qpAdm model that uses Ancestral South Indian?
Order the Ancestrify qpAdm analysis (€29.99, one-time) and upload the raw file you already have from a consumer test. Your genome is merged into the AADR reference panel and modelled across both eras; each era's model is built from that era's source populations, so a model for the Hunter Gatherer and Neolithic Farmer era draws on Ancestral South Indian where it improves the fit.
Can I model Ancestral South Indian ancestry for free first?
Yes. The Ancestrify Lab runs Global25 admixture calculators, a nearest-populations distance tool and an AdmixTools 2 workbench in your browser with no account, and several calculators cover the Hunter Gatherer and Neolithic Farmer era. Those are G25 fits, not formal qpAdm models — the paid analysis is the one with a p-value.
More populations from the Hunter Gatherer and Neolithic Farmer era
Browse the full directory of source populations, or continue with another population from the same era:
Anatolian Neolithic Farmer8500 – 6000 BC
Caucasian Hunter Gatherer13000 – 7000 BC
Eastern Hunter Gatherer12000 – 5000 BC
Iberomaurusian15000 – 8000 BC
Iranian Neolithic Farmer8000 – 5000 BC
Native American15000 – 1500 BC
Natufian12000 – 8000 BC
North African Farmer5200 – 4000 BC
Northeast Asian6000 – 2000 BC
Sub Saharan African
Western Hunter Gatherer12000 – 6000 BC
Western Steppe Herder5000 – 2800 BC